Cracking XAI Code: Scalable, Human-Centric Explanations for Stock Price Predictions
🧠 TL;DR: How MarketCrunch AI Scaled Trustworthy Model Explanations for Next Day Stock Price Predictions
At MarketCrunch AI, we believe in providing transparent analysis to everyday investors. To that end, we wanted to answer: how is our neural network model predicting this value.
We explored traditional explainability methods like LIME [2] (fast but inconsistent), SHAP [1] (rigorous but slow), and counterfactuals [3] (intuitive but hard to scale). To meet real-time performance needs, we first optimized SHAP using techniques like batching, background sample reduction, and limited coalition sampling. But that still wasn't fast enough - so we pivoted to local SHAP explanations, which offered actionable insights at a fraction of the cost.
Then we layered in LLMs to turn raw SHAP values into plain-English summaries grounded in fundamentals, technicals, sentiment, and market context.
In blind tests, over 93% of users preferred these SHAP + LLM explanations, citing better clarity, trust, and decision confidence. Today, every prediction on MarketCrunch AI comes with a fast, human-readable explanation - turning black-box AI into a research partner, not just a number generator.
— — — — — — — — — — — — — — — — — — — — — — —
We believe in making neural network based predictions explainable at MarketCrunch AI. Our platform delivers AI-driven insights to over 3,000 users by analyzing everything from price history to sentiment and macro trends. But when it comes to financial decisions, one thing matters just as much as the prediction itself: the reason behind it.
This post shares how we began cracking that code — building scalable, human-centric explanations that help investors make sense of what the model sees, and why it matters.
Why We Care About Explanations
For an AI model's output to be truly valuable, it needs to be actionable [4, 5, 6]. And action requires trust. We've found that when users understand why a prediction was made, they're far more likely to rely on it. That's why we began exploring one of the most important - and fast-evolving - areas of machine learning: Explainable AI (XAI). https://github.com/BirkhoffG/Explainable-ML-Papers
Interpretability vs. Explainability
Before diving into how we explain predictions, it's important to understand the difference between interpretability and explainability.
Interpretability refers to models that are transparent by design. In a linear regression or decision tree, you can directly see how each input affects the output just by looking at the parameters. These models are easy to reason about.
But most powerful modern models — especially deep neural networks — are not interpretable. Their logic is distributed, non-linear, and abstract, making them difficult to understand from the inside.
This is where explainability comes in. Explainable AI (XAI) is a field focused on developing methods that make complex models more understandable — even when their internal mechanics are opaque. These methods work after the model has been trained, helping us understand how the model behaves in specific scenarios.
Put simply:
- All interpretable models are explainable.
- But not all explainable models are interpretable.
- That's exactly what XAI is designed to address.
Learning the Hard Way: Our Initial Attempts
Our early efforts to build explanations started with what seemed like a straightforward approach: inspecting the weights of the first dense layer in our neural networks.
This gave us a rough sense of which features were being activated early in the model's computation — but it quickly showed its limitations.
- It assumed a linear relationship between inputs and outputs, which doesn't hold in deep, non-linear networks.
- It ignored the way later layers remix signals and interactions.
- And it was fragile: even a small change to the model architecture could render our explanations meaningless.
While it was a natural first step, we realized it couldn't meet the needs of real investors relying on our insights. We needed explanations that were more robust, consistent, and grounded in model behavior — not internal weights.
Navigating the Landscape of Explanation Methods
As we explored how to explain our model's predictions, we tested three of the most widely used techniques in Explainable AI: LIME, SHAP, and Counterfactual explanations. Each had strengths — but none gave us everything we needed for real-world use in investment research.
LIME offered speed and simplicity by fitting a local surrogate model around an instance. But its explanations were often inconsistent, varying depending on how the neighborhood was sampled.
SHAP, grounded in Shapley values from game theory, gave us consistent and mathematically rigorous feature attributions. However, it was computationally expensive and not ideal for real-time use.
Counterfactuals were the most intuitive: "If X changed, the prediction would change." But generating valid counterfactuals for financial data — complex, noisy, and high-dimensional — proved unreliable at scale.
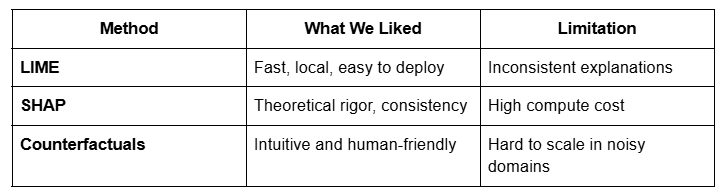
Each method had something we wanted. But none delivered all three out of the box — so we engineered our own hybrid approach
Hacking SHAP: From Sluggish Insights to Real-Time Explanations
We started with global SHAP explanations using KernelSHAP to understand feature importance across the entire dataset. Its model-agnostic design and ability to account for correlated features made it a strong theoretical choice — especially in finance, where multicollinearity is the norm.
But it was slow. Over two minutes per prediction — far too long for a platform designed to serve thousands of users in near real-time.
We engineered around this with several key optimizations:
- Trimmed background datasets to reduce the cost of simulating feature absence.
- Limited the number of sampled feature coalitions to approximate SHAP values faster.
- Batched predictions to improve throughput and reduce compute overhead.
While these improvements helped, we still couldn't fully meet our latency goals. So we made a strategic shift: rather than trying to explain the entire model, we narrowed in on local SHAP explanations — focusing only on what drove a specific prediction. This not only improved performance but made the insights more relevant and actionable for users.
Making Explanations Intuitive with LLMs
SHAP gave us a ranked list of features — but turning that into something a human can actually use required another layer. Traditional counterfactual explanations offer natural, "if-this-then-that" style reasoning, but they're computationally expensive and hard to scale in high-dimensional, noisy domains like financial markets.
So we turned to a Large Language Model (LLM) — not to make predictions, but to interpret and narrate them.
Through careful prompt engineering, we fed the LLM:
- The top SHAP-ranked features (positive and negative drivers),
- Recent stock-specific data (technicals, sentiment, macro context),
- And explanatory structure templates inspired by how research analysts write.
The result: comprehensive, structured, plain-English summaries that feel more like an investment research report than machine output.
— - - - - - - - - - - - - - - - - - - - - - - - - - - - - - - - - - - - -
Example Explanation:
Technical Analysis examines key indicators to predict future stock movements.
Positive Indicators (Pushing Price Up)
- Open (Most Important): The opening price shows strong initial demand, signaling bullish sentiment.
- SHV_Correlation: Tracks short-term Treasury bonds; a positive link suggests stability and investor confidence.
- EMA_5: A short-term moving average trending upward indicates recent price strength.
Negative Indicators (Pulling Price Down)
- High: The stock is near its recent high, which may lead to profit-taking and resistance.
- Volume: Lower recent volume weakens price support, reducing momentum.
- SMA_20: A mid-term average suggests potential resistance if the price struggles to break higher.
Volatility Impact: Moderate volatility could amplify swings, adding some uncertainty to the forecast.
Summary: Strong opening demand and bond market stability support upward momentum, but resistance near highs and weak volume may limit gains.
— - - - - - - - - - - - - - - - - - - - - - - - - - - - - - - - - - - - -
This system captures the clarity of counterfactual-style reasoning, the mathematical rigor of SHAP, and delivers it with the narrative fluency of an analyst — without the latency tradeoffs.
Blind Evaluation - Internal Validation
To evaluate the effectiveness of our SHAP + LLM explanations, we conducted a structured blind test within internal team members and active traders :
Results
- 93% preferred the SHAP + LLM based explanation
- Feedback emphasized the following in favor of SHAP + LLM: Greater detail and clarity, Better readability and structure, Higher perceived trustworthiness, More actionable insight
This validation confirmed what we'd suspected: our engineered approach provided not just faster and more consistent outputs — but also explanations that actually helped users make informed decisions.
As a result, we fully deprecated our earlier method and adopted the SHAP + LLM hybrid system as the foundation of all explanations on MarketCrunch AI.
Final Thoughts
Building explainability into stock prediction models isn't easy — but it's essential. Our journey started with a simple question from our users: "Why is the model predicting this?" That question led us through failed first attempts, careful evaluation of XAI methods, and ultimately, a system that blends the rigor of SHAP with the clarity of natural language.
At MarketCrunch AI, we're not just building a prediction engine — we're building something investors can trust. By making our models more transparent, understandable, and human-centered, we're turning AI into a research partner, not just a black box.
This is just the beginning. Try it out at marketcrunch.ai and see how explainable AI can help you invest with more confidence — and more clarity.
References
[1] Lundberg, Scott M., and Su-In Lee. "A unified approach to interpreting model predictions." Advances in neural information processing systems 30 (2017). https://proceedings.neurips.cc/paper_files/paper/2017/file/8a20a8621978632d76c43dfd28b67767-Paper.pdf
[2] Marco Tulio Ribeiro, Sameer Singh, and Carlos Guestrin. 2016. "Why Should I Trust You?": Explaining the Predictions of Any Classifier. In Proceedings of the 22nd ACM SIGKDD International Conference on Knowledge Discovery and Data Mining (KDD '16). Association for Computing Machinery, New York, NY, USA, 1135 - 1144. https://doi.org/10.1145/2939672.2939778
[3] Ramaravind K. Mothilal, Amit Sharma, and Chenhao Tan. 2020. Explaining machine learning classifiers through diverse counterfactual explanations. In Proceedings of the 2020 Conference on Fairness, Accountability, and Transparency (FAT* '20). Association for Computing Machinery, New York, NY, USA, 607 - 617. https://doi.org/10.1145/3351095.3372850
[4] Ustun, Berk, and Cynthia Rudin. "Learning optimized risk scores." Journal of Machine Learning Research 20.150 (2019): 1–75. http://jmlr.org/papers/v20/18-615.html
[5] Berk Ustun, Alexander Spangher, and Yang Liu. 2019. Actionable Recourse in Linear Classification. In Proceedings of the Conference on Fairness, Accountability, and Transparency (FAT* '19). Association for Computing Machinery, New York, NY, USA, 10 - 19. https://doi.org/10.1145/3287560.3287566
[6] Ebrahimi, Raman, Kristen Vaccaro, and Parinaz Naghizadeh. "The double-edged sword of behavioral responses in strategic classification: Theory and user studies." arXiv preprint arXiv:2410.18066 (2024). https://arxiv.org/abs/2410.18066
— - - - - - - - - - - - - - - - - - - - - - - - - - - - - -
About us
- MarketCrunch AI on Pitchbook and Crunchbase
- Producthunt launch
- Follows on LinkedIn and X (formerly Twitter)