AI price targets are seductive for the same reason horoscopes are: they turn uncertainty into a single number that feels actionable.
But a target is not a guarantee. It's not "the price will be $258.65 tomorrow." It's closer to: "Given what the model sees right now, the most likely outcome clusters around $258.65 - with risk, and with scenarios where it's wrong."
This post shows you how to read MarketCrunch AI targets like a disciplined Robinhood trader - so you can use the signal without falling into the classic traps: overconfidence, cherry-picking, and "YOLO calls because the AI said green."
We'll walk through a real example (AAPL for 01/20/2026) and translate every metric into decisions you can actually make: the following Price Target was created on Jan 17, 2026 (Friday).
Step 1: Start with "What's the timeframe for this target?"
Most traders misread AI targets because they treat them like long-term price calls. MarketCrunch AI gives you timeboxed estimates (like next-day and end-of-week). That matters because:
- A next-day target is usually a trade management tool (entries, exits, sizing, short-dated options selection).
- An end-of-week outlook helps you understand the short swing window (2–5 trading days) and likely range.
Example (AAPL)
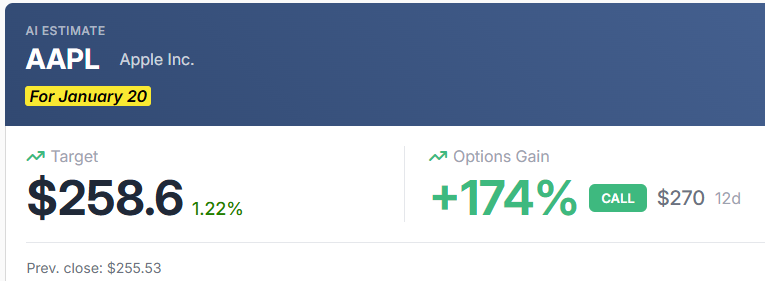
- Next-Day Target (01/20/2026): $258.65. From current $255.52, that's +1.23%.
- End-of-Week Outlook: $257.49, range $254.51–$261.92
- Model Confidence: High (73.5/100)
A +1.23% next-day move is not "moonshot." It's a modest edge - the kind that can be meaningful if you manage risk and don't overpay for leverage.
Step 2: Translate target into trading "map"
Instead of thinking "AI says up," think:
- Where could price go if the model is right?
- Where is the trade wrong?
- What path does price likely take (range, chop, breakout)?
That's how you keep yourself from "fooling yourself" - because your plan is built on invalidation, not hope.
Step 3: Don't ignore the "context panel" - hit rate, sentiment, and analyst consensus
A target without context is like a GPS without traffic.
1) Prior hit rate (your reality check)
In the screenshot, AAPL's prior hit rates show:
- 90 days: 42%
- 30 days: 47%
- 7 days: 29%
This is not saying the model is "bad." It's reminding you that short-horizon prediction is hard - and outcomes vary by regime. Here's how to use it: Hit rate trending up (90d → 30d) can suggest the model is adapting well recently. 7d drop can signal a choppy or regime-shifting week (news, earnings positioning, macro surprises) where short-term targets are less reliable.
Trader takeaway: if recent hit rate is weak, trade smaller, demand better entry, or wait for confirmation.
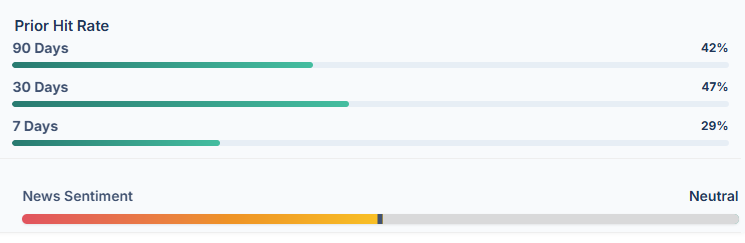
2) News sentiment
AAPL sentiment is Neutral. That means the model is not getting a "free push" from strong positive headlines. Helpful, because your edge isn't dependent on a news narrative.
3) Analyst consensus (longer-term anchor, not a timing tool)
41 analysts average: $252.35, rating: Buy. Forecast range (12 mo): $175–$315, average $252.
Analyst targets are 12-month style anchors. They're not for tomorrow. But they can help you spot when the market is leaning too pessimistic or optimistic.
In this case, the next-day AI target is above the analyst average. That's not a contradiction - just different horizons.
Trader takeaway: Use analyst consensus as a "gravity reference" (is the stock broadly loved/hated?), not as a trigger.
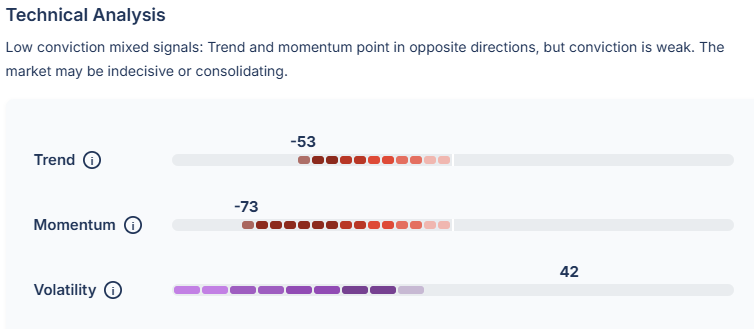
Step 4: Understand the "contradiction"
This is where most traders either panic ("AI must be wrong") or overreach ("countertrend reversal guaranteed!"). The correct reaction is: this is a higher-skill setup that needs rules.
What the technicals are saying (AAPL)
Active signals (click the 'i' next to Trend, Momentum, Volatility)
- ✅ Breakout Retest Pattern: retesting support around $254.93
- ❌ Trend Indicators: below key EMAs (EMA20 $264.85, EMA50 $266.50)
- ❌ 52-week high: ~14.8% below $288.62
- ❌ Volume breakout: 1.47x average (needs 1.5x+ for breakout confirmation)
Indicators:
RSI: 10.5 (deeply oversold), MACD: -4.24 (bearish momentum), Trend score: -53.21 (bearish), Momentum score: -73.46 (strongly bearish)
Key levels:
- Support: $254.93
- Resistance: $261.01 (notable, many touches)
- Major resistance: $276.92
What the model is implying
Your interpretation line is exactly how to think about it:
The model predicts a modest gain despite bearish technical indicators, suggesting a potential countertrend move. High confidence suggests strong conviction.
In plain terms: trend is down, but the model thinks a short bounce is statistically favorable. That's common in oversold conditions.
Trader takeaway: This is not a "breakout buy." It's a countertrend bounce thesis - and countertrend trades require tighter risk control.
Step 5: Using "confidence" - it's not what you think!
A confidence score is NOT "probability of being right."
Confidence is closer to: "How strongly the model prefers this estimate versus alternatives, given the patterns it recognizes."
Why this matters:
- You can have high confidence and still be wrong if the market shifts regimes (macro shock, surprise news, earnings leak).
- You can have lower confidence and still be right - just with less margin.
So how should a retail trader use confidence?
A practical rule
- High confidence: you may size slightly larger if the setup has clean levels and your downside is defined.
- Low confidence: you demand confirmation (breakout, volume, reclaiming moving averages) or trade smaller.
In this AAPL setup, high confidence helps you justify considering the bounce - but the technical backdrop forces discipline.
Step 6: Reading Options an +175% "expected return"
The UI highlights: Best option identified: "$270 Call, exp 01/30/2026, expected return +175.1% with Time to expiry: 12 days. When you click to open the Options details the Greeks say- Delta: 0.0435, Theta: -0.0274, Vega: 0.0414
Let's translate:
Delta (0.0435): "How much this option reacts to the stock"
A delta of ~0.04 means the option moves like 4% of the stock's move (rough intuition). That's tiny because $270 is far out-of-the-money relative to $255–$259.
Implication: AAPL can move up modestly and this contract may still barely respond - until price gets closer to the strike.
Theta (-0.0274): "The daily leak"
Time decay is the tax you pay for waiting. With short-dated options, theta is why traders wake up red even when the stock didn't move much.
Vega (0.0414): "Sensitivity to implied volatility"
Low vega sensitivity means volatility changes won't rescue the position much.
So how can it show +175% expected return? Because percentage returns explode if the option goes from "almost worthless" to "less worthless" - but that doesn't mean it's likely.
Here's the real lesson:
- Deep OTM calls = lottery tickets (high % payoff, low probability)
- ATM / near-ITM calls = higher probability, lower headline % payoff
- Shorter expirations = higher theta risk (your clock is louder)
Trader takeaway: If the AI target implies a modest move (+1.23%), your options choice should match that reality. Deep OTM calls often require a bigger move than the model is even predicting.
Step 7: Use backtest as "evidence," not a promise
The backtesting screenshot shows: our predictions return: 19.32% v. Buy/Hold return: 4.57% with a Sharpe: 0.71 vs 0.36. This is useful because it tells you the approach has historically added value in that tested window.
But don't fool yourself: Backtests can look great in specific regimes. They don't guarantee your next trade wins. The right way to use backtesting is to justify process confidence, not trade certainty.
Trader takeaway: Treat backtesting as "the tool has worked before," not "this trade must work now."
Putting it All Together
Below are a few "template playbooks." They are not recommendations - use them to structure thinking.
A) Countertrend swing trade (shares)
If you believe the bounce thesis:
- Entry zone: near support $254.93–$255.50
- Target: $261.01 resistance (about +2.2% from $255.50)
- Stop: below $254.50 (support break)
- Why it makes sense: RSI is extremely oversold + model expects a modest rebound even while trend is bearish.
This is clean because it has: a defined entry, a defined invalidation level, a realistic target aligned to resistance.
B) Options leverage (defined-risk)
If you want leverage without pretending you're in a movie:
- More conservative: near-the-money (example: $255 or $260 calls) with small size
- More aggressive: $270 call only if you treat it as a small, capped-risk flyer
Position sizing concept (simple): Decide the max dollars you're willing to lose first. Keep that number small enough that you don't revenge trade.
C) Breakout watch (confirmation-first)
If you don't like countertrend trades:
- Wait for price to reclaim $261.01 (resistance break)
- Confirm volume > 1.5x average
- Stronger confirmation: price back above EMA20 (~$264.85)
This is slower, but it reduces "knife catching."
D) Risk checklist (the "don't fool yourself" list)
Before acting, ask:
- If the model is wrong, where will price prove it quickly?
- Does my instrument (shares vs options) match the size of the predicted move?
- Am I depending on a breakout that the dashboard explicitly says isn't confirmed?
Want the "plain English" version of how our AI works?
If you want to go deeper on how MarketCrunch AI thinks (without math overload), these two reads are designed to be approachable: Explain Like I'm Five: Our AI in Plain English. For deeper analysis, see Cracking the xAI Code: Scalable, Human-Centric Explanations for Stock Price Predictions
Final word
No one can predict the markets. The goal is to think of Quant-based AI targets as a decision support, not as a substitute for a plan.
If you take one thing from this post, let it be this: A good trade is not "AI said so." A good trade is "I know where I'm wrong, and my risk is defined."
That mindset - more than any single target - is what keep everyday traders in the game long enough to actually benefit from an edge.
This is not a financial advice. Past performance is not a guarantee for future results. Information presented here is for education purpose only. Write us at support@marketcrunch.ai