Rotations don't announce themselves - they creep in as rates, inflation, and positioning shift. If you can read those regime changes early, you can tilt your portfolio before the crowd. That's where explainable AI shines: not by guessing tops and bottoms, but by showing why a sector's edge is improving or fading.
Sector Rotation 101 (and why regimes matter)
A sector-rotation strategy shifts exposure as the economy moves through business-cycle phases - expansion, slowdown, contraction, recovery. Historically, certain sectors tend to outperform in specific backdrops (e.g., financials can benefit when rates rise and curves steepen; staples and utilities often help in slowdowns). Think of it less like day trading, more like regime positioning. (Fidelity intro, MSCI inflation take.)
Two regime levers dominate most rotations:
- Rates & the yield curve: Rising policy rates/steeper curves can re-price financials and compress long-duration growth multiples; falling rates often relieve rate-sensitive sectors like real estate. (Investopedia on rising rates.)
- Inflation dynamics: Energy/materials often catch a bid on inflation shocks; defensives help when growth cools and pricing power matters. (MSCI quick take.)
What Traditional Screens Miss
Classic rotation tactics - single-indicator momentum, one-off valuation screens, or narrative chasing - tend to lag or overfit to the last cycle. They also ignore cross-winds: options positioning, news tone, insider/institutional flow, and macro surprises. That's how you get whipsawed when the regime shifts abruptly or when different forces offset each other.
This is where explainable AI helps.
The goal isn't forecasting the future with certainty; it's pattern recognition at scale across many prior regimes - with the model telling you which factors are driving conviction and how confident it is right now. (See our plain-English explainer)
An AI-First Playbook for Rotation
1) Read the rate regime
Start with Treasuries and the curve. Is the 10-year yield trending up or down? Is the curve steepening from deeply inverted levels? Pair that with CPI surprises and Fed-path shifts. Rising-rate/rising-inflation regimes tend to reward cash-flow-today sectors (financials, energy), while falling-rate or disinflation regimes can re-inflate duration-sensitive growth and traditionally real estate, but not Data Center buildout.
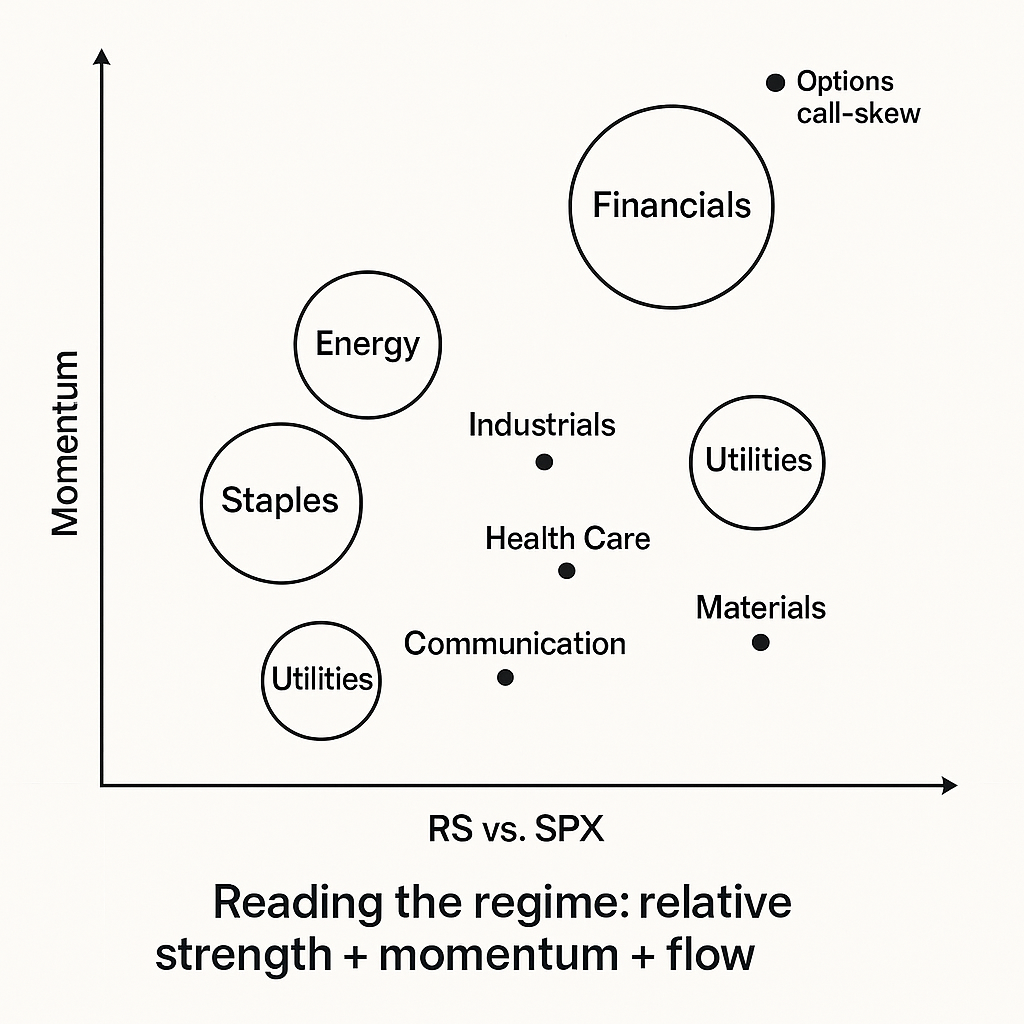
2) Confirm with relative momentum & breadth
Don't rotate on macro alone. Require relative strength of sectors vs. the benchmark and healthy breadth (advancers vs. decliners). Tools like SSGA's Sector Momentum Map or a simple RS-vs-SPX screen help verify that leadership is broadening, not just a one-ticker story. (SSGA Momentum Map)

3) Add flow & sentiment context
Layer in options flow, news/sentiment, and insider/institutional activity. A sector bid that's confirmed by call-buying, improving tone, and insider accumulation is more durable than one that's purely macro-driven. (See MarketCrunch AI multi-factor inputs.)
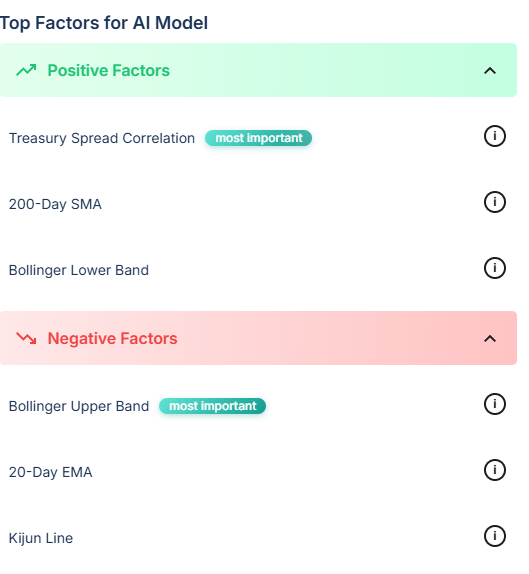
4) Demand explainability & backtests
For each potential rotation, ask: Which factors are pushing this call? How did this setup perform historically across regimes? Require factor attributions, confidence bands, and Sharpe/return vs. buy-and-hold in backtests. (standard with any analysis using MarketCrunch AI)
How MarketCrunch AI Operationalizes This
MarketCrunch AI ingests technicals, macro (Treasuries/CPI/Fed), options flow, news/sentiment, insider/institutional footprints, and more. Multiple specialized models vote on the setup (e.g., rate-regime model, technical momentum model, flow model). The system then blends them into next-day and 7-day price targets with confidence and factor contributions - so you see why a sector tilt is warranted. (Plain-English explainer)
What this looks like in practice:
Rising-rate drift (curve re-steepening):
- Signals: Improving financials RS vs. SPX; curve-sensitive factor rising; call-flow tilt to banks; neutral-to-positive sentiment.
- MarketCrunch view: "High confidence" when multiple models agree and backtests show this regime historically favors financials. Position sizing increases accordingly. (Rates & sectors background.) Investopedia
Inflation scare:
- Signals: Energy/materials RS inflects; CPI surprise positive; options skew to upside in energy; news tone improves.
- MarketCrunch view: Tilt toward energy/materials with clear factor attribution - macro and flow doing the heavy lifting. (MSCI inflation context.) MSCI
Late-cycle slowdown:
- Signals: Falling long yields; staples/utilities RS improves; volatility of cyclicals rises; sentiment cools.
- MarketCrunch view: Rotate into defensives with defined risk, and reduce cyclicals until breadth improves. (Fidelity & Investopedia rotation basics, overview.)
The key is explainability. MarketCrunch AI doesn't just say "rotate to X." It shows factor contributions (e.g., "rates + sentiment + options flow") and provides confidence bands so you can right-size the tilt. (MarketCrunch style/criteria)
The Takeaway
Sector rotation is a regime trade. You win not by predicting headlines, but by acting when rates, momentum, and flows align - and by insisting on explainability before you tilt.
If you want that discipline without a 50-tab workflow, try a tool that shows its work. MarketCrunch AI aggregates the right signals, scores confidence, and explains the "why" - so you can rotate with conviction, not vibes. (Bond-markets matter style piece.)
If you found this useful, follow us for more on markets, AI, and practical playbooks. https://marketcrunch.ai/#blogs