
"All models are wrong, but some are useful." - George Box
At MarketCrunch AI, we take it further - we evaluate the usefulness of our models through measurable confidence scores.
TL;DR: Predictions without confidence measures are dangerous. At MarketCrunch AI, we quantify uncertainty for every next-day stock price forecast — so you don't just know what might happen, but also how sure we are.
We use a two-stage method combining Monte Carlo Dropout [1] (for model uncertainty) and Bootstrap Resampling [2] (for data noise) to quantify confidence. This approach reduced Negative Log-Likelihood [3] (NLL) by 18.2% compared to MC Dropout alone, producing more calibrated and trustworthy scores.
These methods are popular in research, as seen in [4, 5, 6] for Monte Carlo Dropout and [7, 8, 9] for Bootstrap Resampling, and leverage basic statistical calculations and approaches to measure the confidence of a method with existing uncertainty.
Why Confidence Matters in AI-Powered Investing
Stock predictions without uncertainty are like weather forecasts that just say, "It'll rain" - with no mention of how likely that rain is.
In investment research, that's not good enough.
MarketCrunch AI's neural forecasts don't stop at predicting stock movement. We quantify how confident we are in each prediction. Because in high-stakes, noisy environments like financial markets, even great models can be wrong, and knowing when they're likely to be wrong is crucial.
The Retail Edge: Why Uncertainty = Power
Retail traders operate without a quant desk or risk management team. This makes prediction confidence more than a technical bonus - it's a strategic necessity.
By exposing uncertainty, we help our users:
- Scale position size based on conviction
- Avoid overtrading weak signals
- Respect the statistical limits of what any model can know
It's not about false certainty - it's about intelligent skepticism. We've engineered our system to deliver not just predictions, but the confidence metrics that turn those predictions into profitable decisions.
Understanding Uncertainty: Two Key Methods
Generating meaningful confidence scores requires methods that address different dimensions of uncertainty. We evaluated Bayesian Neural Networks, Deep Ensembles, and Quantile Regression, but prioritized Monte Carlo Dropout and Bootstrap Resampling for their balance of speed and interpretability in trading environments.
Monte Carlo Dropout (MC)
- Purpose: Measures epistemic uncertainty - the model's internal uncertainty about its parameters.
- Process: By running the model 100 times with dropout enabled, we generate a distribution of predictions.
- Key Insight: A tight cluster of predictions indicates high confidence; a wide spread signals uncertainty.
- Trader's Takeaway: Answers, "Is the predicted move strong enough to rise above the model's noise?"
Example:
- Low confidence: Prediction: +0.1% (±0.3%). Weak signal.
- High confidence: Prediction: +3% (±0.3%). Strong signal.
Scoring: Coefficient of Variation (CV = σ/μ). Lower CV = higher confidence.
Bootstrap Sampling
- Purpose: Measures aleatoric uncertainty - noise inherent in the data.
- Process: Resample predictions thousands of times to test stability.
- Key Insight: Consistent averages across resamples indicate robustness; large swings suggest fragility.
- Trader's Takeaway: Answers, "Is this prediction stable or a fluke?"
Example:
- Low uncertainty: Averages cluster near +2%. High uncertainty: Averages range from -0.5% to +4%.
- Scoring: Normalized standard deviation of resampled averages. Smaller spread = higher confidence.
Building a Robust and Comprehensive Confidence Estimation
To create actionable confidence scores, we rigorously tested uncertainty estimation techniques - Monte Carlo Dropout and Bootstrap Resampling - across thousands of stock predictions under diverse market conditions. While each method provided unique insights, both had limitations:
- Monte Carlo (MC) Dropout effectively captured epistemic uncertainty (model uncertainty) by simulating 100 stochastic forward passes with dropout enabled. However, it couldn't assess the statistical stability of predictions.
- Bootstrap Resampling addressed aleatoric uncertainty (data noise) but required existing prediction distributions to work with.
Our Solution: A Two-Stage Framework
We combined these approaches to holistically quantify uncertainty:
Stage 1: Model Uncertainty (MC Dropout)
- Run 100 stochastic predictions with dropout at inference time.
- Output: A distribution of predictions revealing the model's internal variability.
Stage 2: Statistical Stability (Bootstrap)
- Resample the Stage 1 predictions 10,000 times.
- Output: Metrics quantifying prediction robustness against data noise.
Final Metrics Derived:
- Mean prediction (point estimate)
- Standard deviation (spread of uncertainty)
- 95% confidence interval (plausible target range, calculated from the 2.5th to 97.5th percentile of the bootstrapped distribution)
This multi-stage approach ensures we account for both the model's knowledge gaps (epistemic) and inherent market noise (aleatoric), yielding calibrated confidence scores.
To convert this into a single, user-facing score, we calculate the Coefficient of Variation (CV) - the ratio of standard deviation to mean - after the second stage, using the full bootstrapped distribution. This gives us a normalized measure of signal-to-noise, which we invert and map to a confidence score between 0 and 100.
MarketCrunch AI's prediction engine uses a dual-environment system: batch processing for comprehensive quality assessment across all tickers, and on-demand training with live explainability generation for user-specific queries.
To evaluate the effectiveness of our model confidence estimation approach, we tested it against the MC Dropout–only baseline using a strict correctness criterion:
A prediction is labeled correct if its absolute percent error is less than 0.5%.
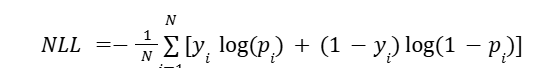
This allowed us to apply Negative Log-Likelihood (NLL) as a scoring function - penalizing overconfident errors more than uncertain ones and quantifying the trustworthiness of our confidence outputs. NLL measures how 'honest' our confidence scores are. If we're wrong when we said we were sure, NLL gets much worse - just like losses grow when traders overcommit to shaky predictions.
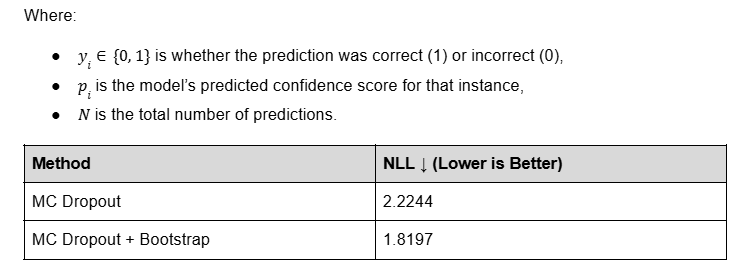
The result: A reduction in NLL by 18.2%, confirming that our systematic approach to combining model-based and distributional uncertainty produces more calibrated, trustworthy, and actionable confidence scores.
To further validate usefulness, we sorted 1.5k+ tickers' predictions by confidence and split them into percentile buckets (top 10%, 20%, ..., 100%). For each group, we calculated the proportion of predictions that had <0.5% absolute error.
Here's what we found:
- MC Dropout alone showed inconsistent correlation between confidence and accuracy, undermining its utility for filtering.
- Our 2-stage approach (MC + Bootstrap) shows a clear, monotonic trend: higher confidence = better empirical accuracy.
This makes our confidence score not just statistically sound, but practically actionable.
*Confidence score vs accuracy analysis conducted across 1.5k+ tickers for predictions made during 3rd week of June, 2025
By integrating probabilistic deep learning with classical statistical inference, we've built a statistically sound and operationally effective confidence scoring system that is robust under volatility, noise, and real-world edge cases.
How to Use Confidence and Accuracy in Trading Decisions
MarketCrunch AI provides two distinct yet complementary metrics on every stock price estimate:
✅ Direction Accuracy (Past 90 Days)
- Reflects how often the model correctly predicted the direction (up/down) of the stock over the past 3 months.
- Example from image: 43% - suggests the model has not consistently predicted direction correctly for this ticker.
- Note: Low accuracy doesn't always mean the model is wrong - it may indicate noisy or non-trend-following behavior in the stock.
🧠 AI Model Confidence (Prediction Uncertainty)
- A forward-looking score based on model uncertainty.
- Derived from MC + Bootstrap, it reflects how consistent the model's predictions are given current input features.
- Example: 62% - the model is fairly confident in this particular forecast, even if past performance is mixed.
Putting It Together in a Strategy
Here's how traders can use these two metrics in tandem:

Final Thoughts
By embracing uncertainty, we're not just making our next day price estimates smarter - we're making them safer. With every signal we generate, we also share how confident we are. That extra layer of transparency is what makes MarketCrunch AI a trusted research partner. Visit- https://marketcrunch.ai/, to see it all in action.
Who are we?
MarketCrunch AI is built by a mission-driven team of engineers, quants, and researchers from MAANG, high-frequency trading, and applied ML labs. We've shipped real-time systems, tuned signals in microseconds, and built AI that scales under pressure.
Our goal? Level the playing field by turning raw market data into fast, explainable, and actionable insights for every investor.
References
[1] Gal, Yarin, and Zoubin Ghahramani. "Dropout as a bayesian approximation: Representing model uncertainty in deep learning." international conference on machine learning. PMLR, 2016.
[2] DiCiccio, Thomas J., and Bradley Efron. "Bootstrap confidence intervals." Statistical science 11.3 (1996): 189–228.
[3] Yao, Hengshuai, et al. "Negative log likelihood ratio loss for deep neural network classification." Proceedings of the Future Technologies Conference (FTC) 2019: Volume 1. Springer International Publishing, 2020.
[4] Seoh, Ronald. "Qualitative analysis of monte carlo dropout." arXiv preprint arXiv:2007.01720 (2020).
[5] Zhao, Rui, et al. "Leveraging monte carlo dropout for uncertainty quantification in real-time object detection of autonomous vehicles." IEEE Access 12 (2024): 33384–33399.
[6] Kummaraka, Unyamanee, and Patchanok Srisuradetchai. "Monte Carlo Dropout Neural Networks for Forecasting Sinusoidal Time Series: Performance Evaluation and Uncertainty Quantification." Applied Sciences 15.8 (2025): 4363.
[7] Fortin, V., and B. Bobee. "Nonparametric bootstrap confidence intervals for the log-Pearson type III distribution." WIT Transactions on Ecology and the Environment 6 (2025).
[8] Debeire, Kevin, et al. "Bootstrap aggregation and confidence measures to improve time series causal discovery." Causal Learning and Reasoning. PMLR, 2024.
[9] Herrera-Casanova, Reinier, Arturo Conde, and Carlos Santos-Pérez. "Hour-Ahead Photovoltaic Power Prediction Combining BiLSTM and Bayesian Optimization Algorithm, with Bootstrap Resampling for Interval Predictions." Sensors 24.3 (2024): 882.
[10] Smithson, Michael. "Confidence interval." International Encyclopedia of Statistical Science. Springer, Berlin, Heidelberg, 2011. 283–284.
[11] O'Brien, Sheila F., and Qi Long Yi. "How do I interpret a confidence interval?." Transfusion 56.7 (2016): 1680–1683.